
Performance Score: The Methodology Behind the BIKY Pulse Indicator

The Performance Score is not designed to show who sells the most. Its purpose is to answer a much more valuable question for decision making: How well is a dealership performing compared with its own evolution and with the rest of its network?
What Is the Performance Score?
Comparing dealerships solely by the number of sales often leads to incomplete conclusions. Larger dealerships start with a natural advantage, while smaller ones may achieve significant growth that goes unnoticed when only absolute figures are considered.
For this reason, the Performance Score developed in BIKY Pulse summarizes the operational performance of a dealership or dealer group into a single numerical indicator accompanied by a visual traffic light. Its purpose is to measure relative performance using a consistent methodology across the entire network.
This indicator answers two fundamental questions at the same time:
- Has the dealership grown compared with its own previous period?
- Is its performance aligned with the average performance of the rest of the network?
By combining these two dimensions, the Performance Score enables objective comparisons between dealerships of different sizes using the same evaluation criteria.
What Information Does the Model Use?
The calculation is based exclusively on operational data collected from the company’s internal systems.
The variables included are:
- Leads.
- Scheduled appointments.
- Appointment scheduling rate.
- Sales.
To ensure fair comparisons, every dealership is always evaluated against two equivalent periods: the current period and the immediately preceding one, using the same duration and the same days of the week.
The Calculation Methodology
Step 1. Growth for Each Metric
For each of the four metrics, the percentage change is calculated relative to the previous period using the standard growth formula.
A value of 100 represents performance that is exactly the same as in the previous period.
Values above 100 indicate growth, while values below 100 indicate a decline.
To prevent extremely small baselines from producing disproportionate variations, the individual growth of each metric is capped at 250 points using a statistical technique known as winsorization.
Step 2. Weighted Growth Score
Not all metrics have the same impact on the business.
For that reason, BIKY Pulse applies a weighted average in which each indicator is assigned a different weight according to its strategic importance.
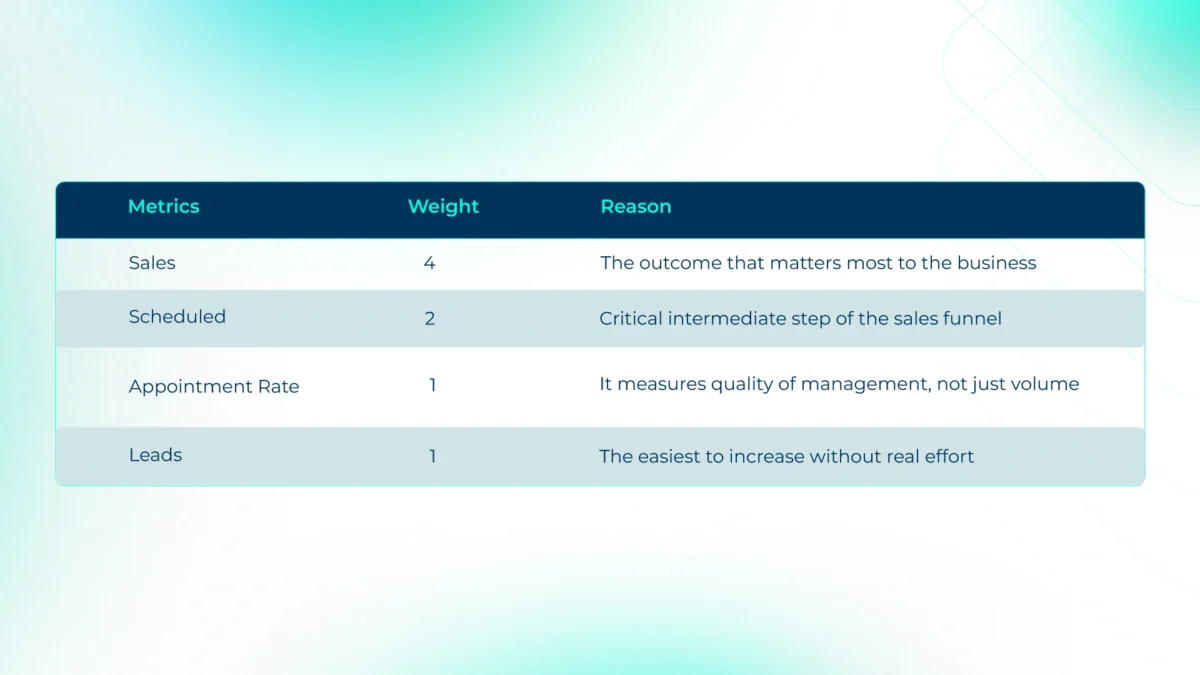
This distribution prioritizes the final outcome of the sales process while still taking into account the indicators that explain its performance.
The weights are documented business parameters and can be recalibrated as more historical evidence becomes available. If a dealership does not have sufficient historical data, the system reports “No data” instead of generating an artificial comparison.
Steps 3 and 4. Volume Adjustment and Final Performance Score
To ensure that a large dealership with sales well above its network average is not placed at a disadvantage compared with another dealership that grew rapidly from a very small base, the model also calculates a relative volume indicator:
Relative Volume = (Dealership Sales / Average Network Sales) × 100
Final Performance Score = (0.8 × Own Growth) + (0.2 × Relative Volume)
The weight assigned to relative volume is intentionally low (0.2) so that recognition for sales volume does not overshadow a genuine decline compared with the dealership’s own historical performance.
Step 5. Traffic Light Classification
To make the indicator easier to interpret, the Final Performance Score is converted into a performance traffic light.
The categories used are:
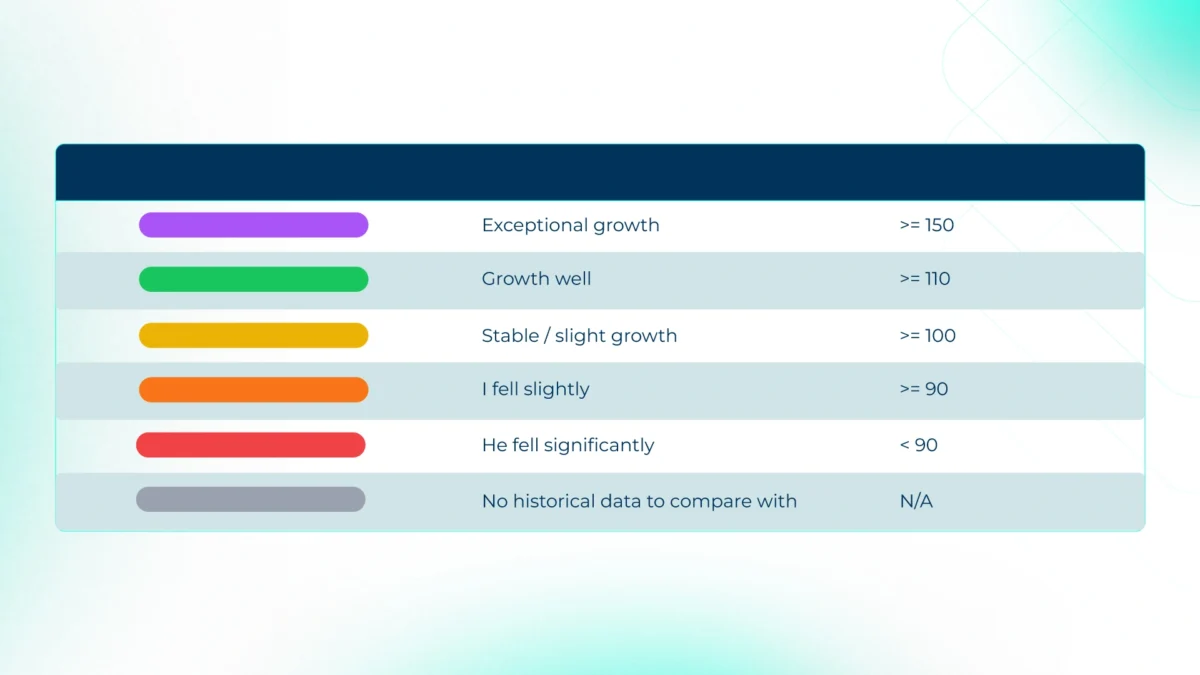
This classification makes it possible to identify the status of each dealership at a glance without losing the precision of the numerical value that supports the evaluation.
What Principles Is This Methodology Based On?
The Performance Score is not an arbitrary metric. Its design combines techniques that are widely used in business analytics, statistics, and multicriteria evaluation.
These include:
- Percentage change between periods.
- Weighted average of indicators (Weighted Sum Model or Simple Additive Weighting).
- Outlier control through winsorization.
- Benchmarking against a reference group.
The parameters currently used, including the 4/2/1/1 weights, the 80/20 combination, the 250 point cap, and the traffic light thresholds, are documented business calibration decisions that can be adjusted as the historical dataset evolves.
The Evidence Behind the Calibration
The weighting assigned to relative volume was not determined theoretically.
During the calibration process, the team analyzed the case of a dealer group that remained the highest selling organization in its network but had experienced a 34.8% decline compared with its own previous period.
With a 40% weighting assigned to relative volume, the result still produced a green traffic light, masking the actual decline.
After reducing that weighting to 20%, the indicator continued to recognize the group’s high sales volume while correctly reflecting the deterioration in its performance trend with a yellow traffic light.
This practical case supports the model’s current configuration and demonstrates the intended balance between historical performance and the relevance of sales volume.
Conclusion
The Performance Score in BIKY Pulse transforms multiple operational indicators into a single, consistent, and comparable metric across the entire network.
By combining historical growth, relative volume, and well established business analytics techniques, the model makes it possible to evaluate dealerships of different sizes using the same criteria while avoiding the biases inherent in comparisons based solely on absolute figures.
Rather than identifying who sells the most, this methodology measures who is improving the most. It provides an objective foundation for rankings, alerts, performance recognition, and future business decisions.